Creating Box Plot in Kibana using Vega is what this tutorial all about. To keep it simple I will use hard coded data. However in the second part of this tutorial the data will come via aggregation from elasticsearch and will be plotted.
WHY
- Box plots are very useful and manufacturing engineers especially love them.
- Kibana at the time of writing does not support boxplot visualization. Yikes!
- Good news: Box plots are supported in Vega-Lite 4.0. And Kibana allows us to use Vega to make visualizations. Lets do it.
- Bad news: Kibana 7.x supports only Vega-Lite 2.6.0. Facepalm.
However here is the big thing. Boxplot aggregation is supported in Elasticsearch 7.x. This opens an avenue to actually plot the results of this aggregation using plain simple Vega.
Idea itself is simple. Do the aggregation in Elasticsearch itself. The values it returns are then used in creating Box Plot in Kibana using Vega.
Life Pro Tip: It is always recommended to do aggregations in Elasticsearch as much as possible. Extracting the raw values out and running Vega on it is not going to scale. It is doomed to end in grief.
HOW
Open kibana and go into visualizations. Choose Vega visualization. Just paste the code snippet given below.
{
  "$schema": "https://vega.github.io/schema/vega/v4.json",
  "description": "A box plot example",
  "width": 600,
  "autosize": "pad",
  "padding": 5,

  "config": {
    "axisBand": {
      "bandPosition": 1,
      "tickExtra": true,
      "tickOffset": 0
    }
  },

  "signals": [
    { "name": "plotWidth", "value": 60 },
    { "name": "height", "update": "(plotWidth + 10) * 4"}
  ],

  "data":
      [
        {
          "name": "boxdata",
          "values":
          [
            {
            "task": "A",
            "min" : 31.08,
            "max" : 82.79,
            "q1" : 41.08,
            "q2" : 51.93,
            "q3" : 62.79
            },
            {
            "task": "B",
            "min" : 23.45,
            "max" : 53.65,
            "q1" : 33.45,
            "q2" : 43.55,
            "q3" : 49.65
            },
            {
            "task": "C",
            "min" : 24.19,
            "max" : 54.337,
            "q1" : 34.19,
            "q2" : 39.26,
            "q3" : 44.33
            },
            {
            "task": "D",
            "min" : 10.22,
            "max" : 45.82,
            "q1" : 12.227,
            "q2" : 22.52,
            "q3" : 36.82
            }
          ]
        }
      ],

  "scales": [
    {
      "name": "layout",
      "type": "band",
      "range": "height",
      "domain": {"data": "boxdata", "field": "task"}
    },
    {
      "name": "xscale",
      "type": "linear",
      "range": "width", "round": true,
      "domain": {"data": "boxdata", "field": "max"},
      "zero": true, "nice": true
    },
    {
      "name": "color",
      "type": "ordinal",
      "range": "category",
      "domain": {"data": "boxdata", "field": "task"}
    }
  ],

  "axes": [
    {"orient": "bottom", "scale": "xscale", "zindex": 1},
    {"orient": "left", "scale": "layout", "tickCount": 5, "zindex": 1}
  ],

  "marks": [
    {
      "type": "group",
      "from": {
        "facet": {
          "data": "boxdata",
          "name": "mytasks",
          "groupby": "task"
        }
      },

      "encode": {
        "enter": {
          "yc": {"scale": "layout", "field": "task", "band": 0.5},
          "height": {"signal": "plotWidth"},
          "width": {"signal": "width"}
        }
      },

      "marks": [
        {
          "type": "rect",
          "from": {"data": "mytasks"},
          "strokeDash": "[8,4]",
          "encode": {
            "enter": {
              "fill": {"value": "grey"},
              "tooltip": {"signal": "datum"},
              "height": {"value": 1}
            },
            "update": {
              "yc": {"signal": "plotWidth / 2", "offset": -0.5},
              "x": {"scale": "xscale", "field": "min"},
              "x2": {"scale": "xscale", "field": "max"}
            }
          }
        },
        {
          "type": "rect",
          "from": {"data": "mytasks"},
          "encode": {
            "enter": {
              "fill": {"value": "steelblue"},
              "tooltip": {"signal": "datum"},
              "cornerRadius": {"value": 5}
            },
            "update": {
              "yc": {"signal": "plotWidth / 2"},
              "height": {"signal": "plotWidth / 2"},
              "x": {"scale": "xscale", "field": "q1"},
              "x2": {"scale": "xscale", "field": "q3"},
              "fill": {"scale": "color", "field": "task"}
            }
          }
        },
        {
          "type": "rect",
          "from": {"data": "mytasks"},
          "encode": {
            "enter": {
              "fill": {"value": "aliceblue"},
              "tooltip": {"signal": "datum"},
              "width": {"value": 2}
            },
            "update": {
              "yc": {"signal": "plotWidth / 2"},
              "height": {"signal": "plotWidth / 2"},
              "x": {"scale": "xscale", "field": "q2"}
            }
          }
        },
        {
          "type": "rect",
          "from": {"data": "mytasks"},
          "encode": {
            "enter": {
              "fill": {"value": "grey"},
              "tooltip": {"signal": "datum"},
              "width": {"value": 2}
            },
            "update": {
              "yc": {"signal": "plotWidth / 2"},
              "height": {"signal": "plotWidth / 2"},
              "x": {"scale": "xscale", "field": "min"}
            }
          }
        },
        {
          "type": "rect",
          "from": {"data": "mytasks"},
          "encode": {
            "enter": {
              "fill": {"value": "grey"},
              "tooltip": {"signal": "datum"},
              "width": {"value": 2}
            },
            "update": {
              "yc": {"signal": "plotWidth / 2"},
              "height": {"signal": "plotWidth / 2"},
              "x": {"scale": "xscale", "field": "max"}
            }
          }
        }
      ]
    }
  ]
}
Click on Update button. And you will see a nice box plot.
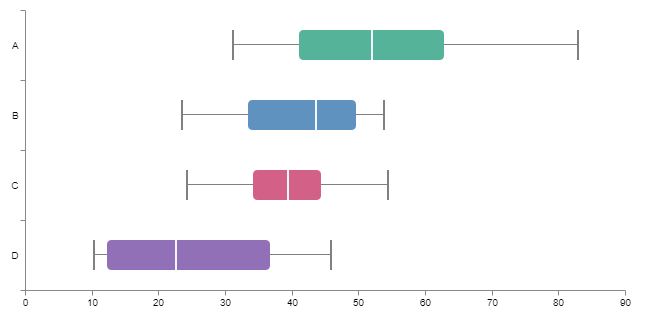
I have added a nice touch. It supports hover text!!
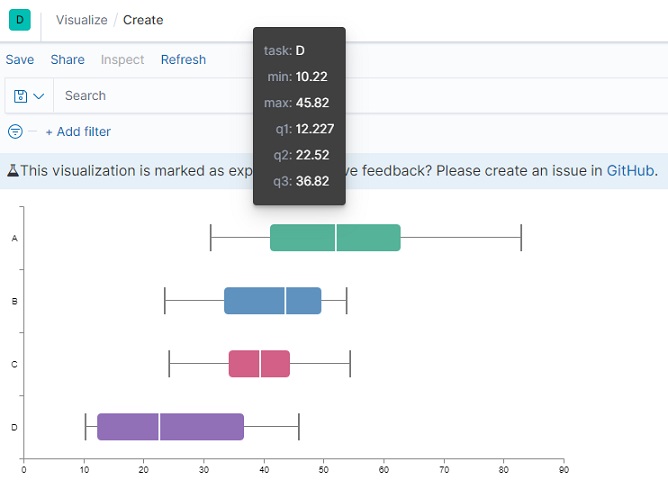
This is very important to a manufacturing engineer. It enables him to see the actual values if needed without leaving the plot.
So what is happening in this code?
I will not go into nitty gritty of the code. Honestly if you are well versed in Vega you won’t be here. On the other hand if you are not comfortable with Vega then you are out of luck. I won’t be explaining it. It will make this tutorial way too long and complicated.
However here are some points. The data I want to plot is named boxdata and is in the same format as the elasticsearch aggregation returns. Well almost. Ask in comments if you need clarifications on some section of code.
Part two of this tutorial will be all about linking the data in Elasticsearch to this Box plot. Stay tuned.

Hi there! Very interesting tutorial! You mentioned this: “The data I want to plot is named boxdata and is in the same format as the elasticsearch aggregation returns. Well almost. ” Could you please explain how I transformed the data from Elasticsearch into “boxdata”? I’m actually struggling with that part. Thanks in advance!
This is what I was planning to cover in the second part of the tutorial. Coming soon. Stay tuned. 🙂
Anyways till that happens here is what you do. Elasticsearch supports boxplot aggregations. You run that as a part of Vega query. The result is then used to plot the box plot.