This post will show how to extract filename from filebeat shipped logs, using elasticsearch pipelines and grok. I will also show how to deal with the failures usually seen in real life. With that said lets get started.
WHY
It is very common to create log files with names containing the identifier. In manufacturing the log files often start with the serial number of the device under manufacture or test. In case of application server, sometimes the log name starts with the transaction id for that session. In short, it is quite common for the name of log file to contain some useful information. And with that comes the inevitable request, Can you please extract filename from filebeat shipped logs and make it available?
HOW
Filebeat sends the fully qualified filename of the logs.
Something like this
\\BC234234\c$\logs\121322\334567348734_2018-07-23 06 44 51_fail.csv
First you have to define a grok pattern to match it. Use the Grok Debugger provided in the Dev Tools section of Kibana.
Here is a sample screen of how to use it. See how the backslashes never miss a chance to make life difficult. They need to be escaped.
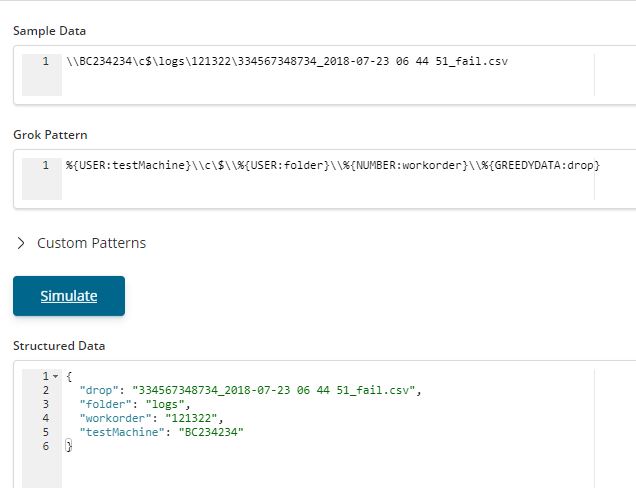
In case you are wondering about USER, NUMBER, GREEDYDATA then yes, they are the regex monsters grok patterns. See what they match here.
Now we are able to extract the filename.
Sometimes the requirement is to extract something from the filename, like the serial number and discard the date part. Here is a screen showing how we do that.
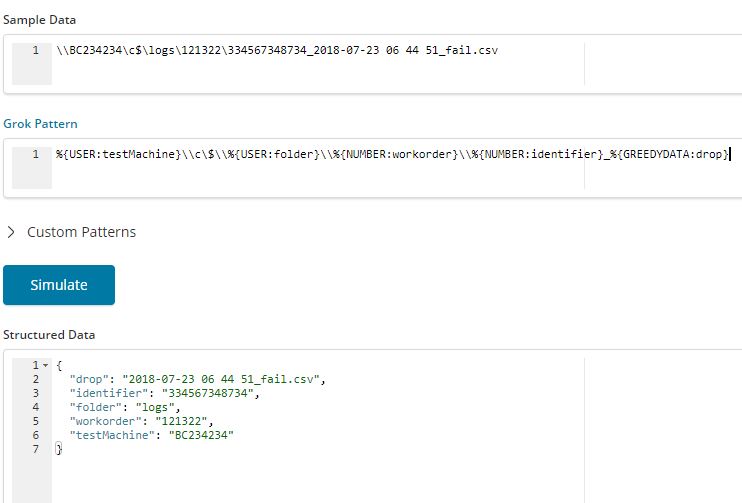
I will continue with this pattern to make it look more real world. Now with the grok pattern sorted lets put in a pipeline to put everything together.
PUT _ingest/pipeline/demo_pipeline
{
    "processors": [
    {
      "grok": {
        "field": "source",
        "patterns": ["%{USER:testMachine}\\\\c\\$\\\\%{USER:folder1}\\\\%{USER:folder2}\\\\%{NUMBER:identifier}_%{GREEDYDATA:drop}"]
      }
    },
    {
      "set": {
        "field": "Identifier",
        "value": "{{identifier}}"
      }
    },
    {
      "remove": {
        "field": ["testMachine","identifier","folder1","folder2","drop"]
      }
    }
    ],
    "on_failure" : [
    {
      "set" : {
        "field" : "_index",
        "value" : "failed-{{ _index }}"
      }
    }
  ]
}
Again look at the backslashes. These guys don’t give up.
Here is what is happening.
Line 05-07 : Use the grok processor to split the source into different parameters.
Line 11-13 : Use the set processor to create a fieldname called Identifier using the value of identifier.
Line 17-20 : Use remove processor to drop the fields we do not need.
Line 22-27 : They are to handle the error which might come up.
The on_failure section of pipeline is very important. Why?
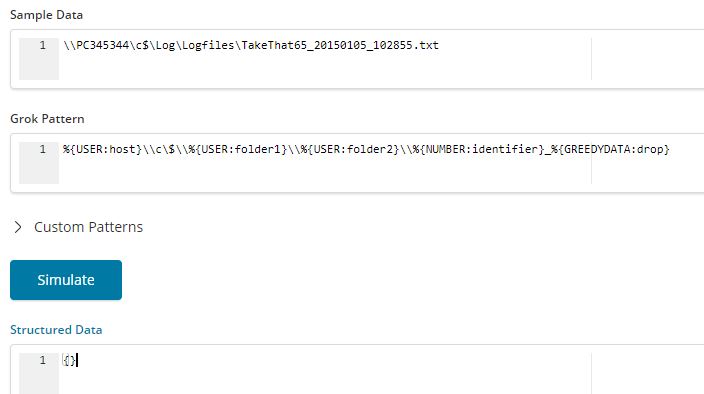
Someone can sneak in a file in the monitored folder which does not conform to grok pattern you wrote.
For example
\\PC345344\c$\Log\Logfiles\TakeThat65_20150105_102855.txt
The result is a failure.
The default behaviour of the pipeline is to halt at first error. You can change it to your wish using the on_failure block. The recommended approach here is to log the data into another index and continue with the processing of the logs. This is what you see happening in the block shown above.
Now just to create a filebeat yml file to start shipping data to your elasticsearch cluster. You can refer to my previous post to see how filebeat is configured.
setup.template.name: "log-demo"
setup.template.pattern: "log-demo-*"

filebeat.inputs:
- paths:
    - \\BC234234\c$\logs\*\*.csv

output.elasticsearch:
 hosts: ["thanosrocks:9244"]
 index: "log-demo-%{+yyyy.MM.dd}"
 pipeline: demo_pipeline


logging.level: info
logging.to_files: true
logging.files:
 path: C:\filebeatStuff\logs
 name: filebeat
 keepfiles: 7
 permissions: 0644
And that’s it. You now know how extract filename from filebeat shipped logs. Keep rocking.
Do you know how to achieve the same with filters in logstash. I use grok filter on the log.file.path field but this is set to null for some reason at the moment of filtering.
I used even ruby filter to see what the field has and it is null:
ruby {
code => ”
event.set(‘something’, event.get(‘log.file.path’))
”
}
However after the logs are all inserted the log.file.path is showing as a field in elastic.
Not sure about logstash. I think “source” is the field you should be looking at. Will think of putting in a post on the this.